Geometry Websites

by C. Elkins, OK Math and Reading Lady

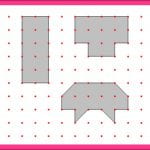
There are several great math websites which might help you and your students with geometry and measurement standards such as area, perimeter, volume, surface area, angles, etc.  The ones I am recommending are interactive and often customizable.  Check them out!! (Each title can be clicked to take you directly to the linked website.)

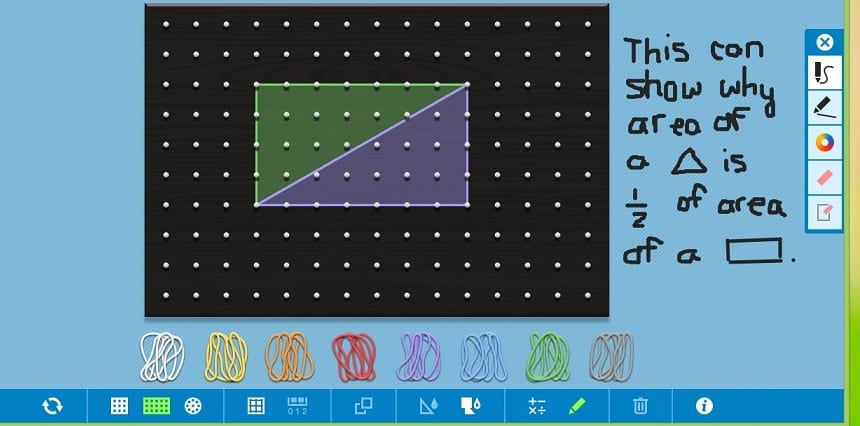
  1. Geoboard by The Math Learning Center:  I love the concept of geoboards to help children create polygons and measure area and perimeter.  However, most teachers have ditched their physical geoboards. They are often in boxes relegated to the basement storage areas.  I get it, though.  They take up a lot of shelf space in the class, there aren’t enough rubber bands to go around (aka geobands), the kids misuse them or break them, they don’t stretch far enough, the pegs get broken, etc.

I think you will LOVE this app. 
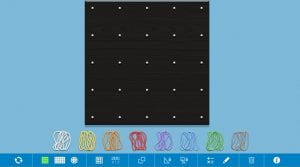
Check out the little “i” on how to get the most use out of it, but it has 2 variations for the board size and you can show it with/without gridlines or numbers. There are different colored bands which you drag to the board and stretch to whichever pegs you need. You can shade in areas, copy, and rotate (which is helpful to see if 2 similar shapes are equivalent). There is also a drawing palette in case you want to freehand something or draw lines (and with different colors as well).

What are the possibilities with this?

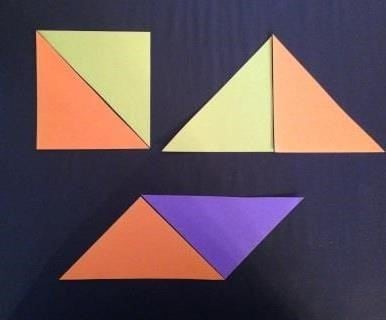
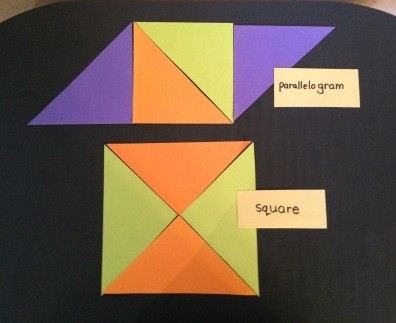
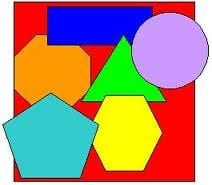
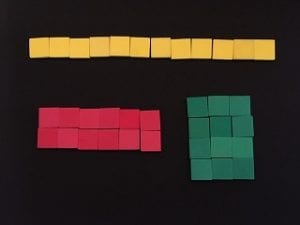
  • Use with primary students to create squares, rectangles, and other polygons. The teacher can elicit different responses with directions such as:  Make a square. Make a different size square. Make a trapezoid. Are any of our trapezoids the same?
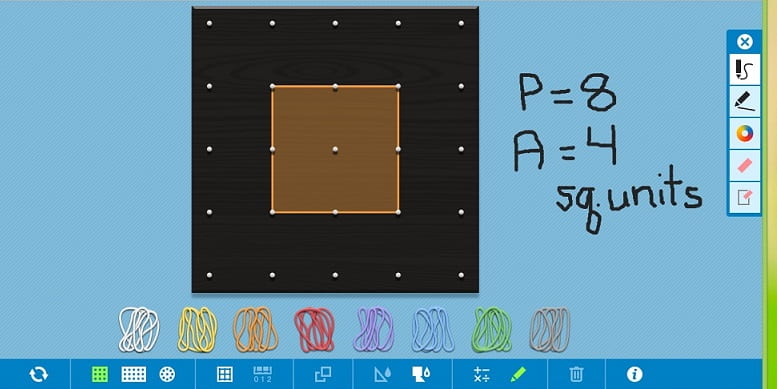
  • Creations can sometimes be recorded on dot paper – although I would reserve this for less-complicated shapes.
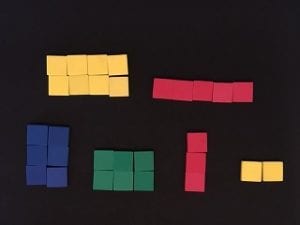
  • Count the pegs around the shape to determine perimeter. The teacher might ask students to create a rectangle with a perimeter of 10 (or 12, or another amount). How many different ways are there? Be cautious with diagonal connections because they are not equivalent to vertical or horizontal connections. Think of how you can get students to discover this without just telling them.
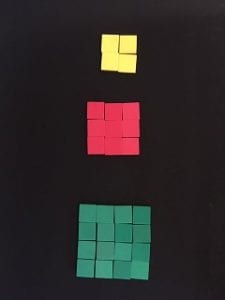
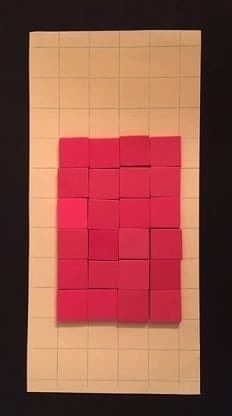
  • Show the gridlines to help students determine area.  Initially,  students may just count the squares inside the shape. Guide students to more efficient ways to figure this (multiplying, decomposing into smaller sections, etc.).
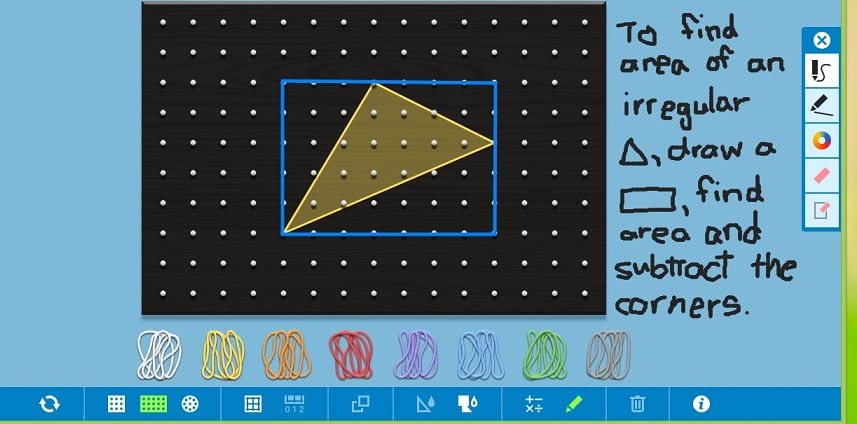
  • This app is also great for creating irregular shapes in which students may decompose into smaller rectangles or triangles. Then check them with the standard formulas.

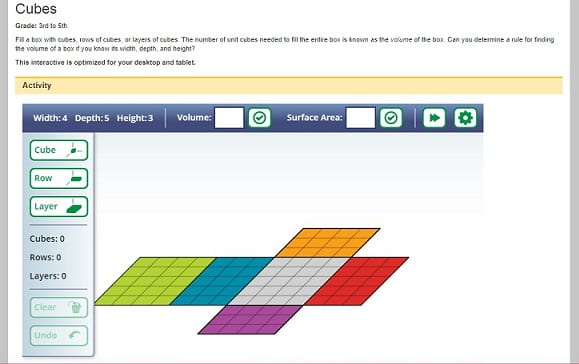
2. “Cubes” at NCTM’s site (Illuminations):  This one is perfect for volume and surface area.

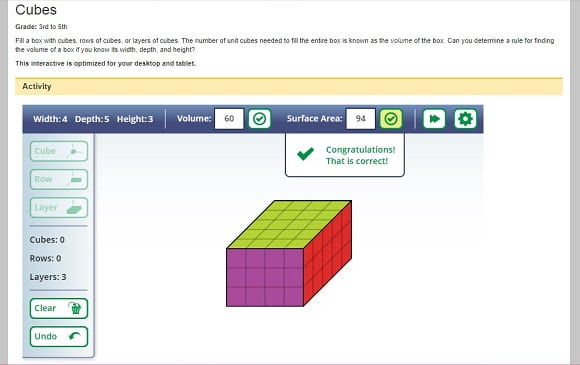
  • Volume:  You can use the gear symbol to select the size (l, w, and h) of the rectangular prism, or use the default ones shown. Then there are 3 tools used to fill the rectangular prism:  individual cubes, rows of cubes, or layers of cubes. I prefer using the layer tool to support the formula for volume as:  area of the base x height.  The base is the bottom layer (which can be determined by looking at the length x the width). The height is the number of layers needed to fill the prism. Once you compute the volume, enter it and check to see if it is correct.
  • Surface Area of Rectangular Prism:  To calculate the surface area, you must find the the area of each face of the prism. Again, you can customize the size using the gear tool.  I prefer this as the shapes shown randomly often are too small to see. Yes, there is a formula for surface area — but conceptually we want students to note the surface area can be thought of in three parts. With a click on each face, this app opens (or closes) a rectangular prism into the 6-faced net making it easier to see the equal sized sections:
    • Area of the front and area of the back are the same
    • Area of the top and area of the bottom are the same
    • Area of each side is the same
    • Be sure to explore what happens when the prism is a cube.

3.Surface area with Desmos:  This link provides an interactive experience with surface area, using a net. This time, the three visible faces of the prism are color coded, which helps with identifying top / bottom; front / back; and side / side. The prisms on this site are also able to be changed so students can see how altering one dimension affects the surface area.

4. “Lines” on GeoGebra

5. “Angles” on GeoGebra

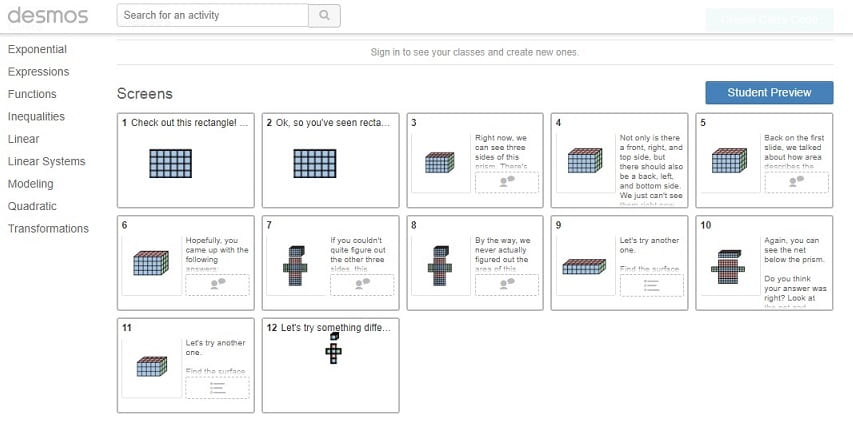
6. “Plane Figures” on GeoGebra

These three may be more relevant to middle school math standards.  Check them out!!  Also take a look at the “Resources” link (left side of web page).  There are plenty of other good links for arithmetic standards as well – too many to list here.  You may have to create a log-in, but it’s FREE!

Enjoy!  Do you have other websites to recommend? Let us know.

Geometry Part 7: Area and Perimeter

by C. Elkins, OK Math and Reading Lady

Today’s topic is the measurement of area and perimeter.  Even though these may be considered measurement standards, they are highly connected to geometry (such as the attributes of a rectangle). Check out previous posts in my Geometry series (Composing and Decomposing) for other mentions of area and perimeter.

Misconceptions provide a window into a child’s thinking.  If we know the misconceptions ahead of time, we can steer our teaching and directions to help students avoid them. I will go through several misconceptions and some strategies and/or lessons that might address them. Misconceptions #1-2 appear in this post. Misconceptions #3-5 will be featured in next week’s post.

Misconception #1:  A student hears this:  “We use area to measure inside a shape and perimeter to measure around a shape.”

  • Problem:  The student doesn’t know how to apply this definition to real situations which require the measurement of area and/or perimeter.
  • Problem:  The student may think, “Since perimeter measures the outside edge, then area means to measure the inside edge.”
  • Problem:  Students confuse the two terms.

Ideas:

  • Brainstorm with students (with your guidance) examples of the need for area and perimeter. Use these scenarios as you solve concrete or pictorial examples.
    • Area:  garden, room size, ceiling tiles, carpet, rug, floor tiles, football field, tv screen, wallpaper, wall paint, etc.
    • Perimeter:  picture frame, fencing, floor trim, wallpaper border, bulletin board border . . .
  • Show this diagram which emphasizes the concept that area measures the entire inside surface using squares of different sizes (cm, inch, foot, yard, mile), while perimeter measures the rim / edge / around an object or shape usually using a ruler, tape measure, or string.  
  • Try this project: Use graph paper and one inch tiles (color tiles) to concretely make shapes with a given area.  Example, “Build a rectangle with an area of 24 tiles.” Specify there can be no holes in the rectangle — it must be solid. Students can experiment while moving the tiles around. Then trace the rectangle and cut it out. With this practice, students are also focusing on arrays and multiplication.  Did they find 4 ways? (2 x 12, 3 x 8, 4 x 6, 1 x 24)? Did they find out a 3 x 8 rectangle is the same as an 8 x 3 rectangle (commutative property)?
    • Note:  Make sure students stay on the given lines when tracing their shapes and cutting. I found this to be difficult for many students even though I said explicitly to “Stay on the lines when you trace.”
  • NO – this is not a solid rectangle. No holes allowed.

  • Similar to the above:  Use the tiles and graph paper to create irregular shapes with a given area – meaning they don’t have to be rectangular. Give the directive that tiles must match at least one edge with another edge (no tip to tip accepted).  And, same as above — no holes in the shape. You can even assign different areas to each small group.  Compare shapes – put on a poster or bulletin board.
  • Using the same shapes made above, determine the perimeter.  I suggest placing tick mark to keep track of what was counted. With this lesson, students will hopefully realize shapes with the same area do not necessarily have the same perimeter. Advise caution when counting corners or insets – students usually miscount these places. 
  • Try this project:  Design a bedroom with dimensions of (or square feet of): ___________ Include a bed, and at least one other piece of furniture or feature (nightstand, dresser, desk, shelf, chair, closet, etc.)
    • The student can use smaller scale graph paper with 1 square representing 1 square foot.
    • Let them have time to “work it out” and practice perseverance as a rough draft before making their final copy.
    • Together, use the square foot construction paper pieces to determine an appropriate size for a bed and other furniture. Students must think of it from an overhead perspective. When I did this with a class, we settled on 3 ft. x 6 ft bed for a total of 18 square feet. We did this by laying the square foot papers on the floor to see in real life what this size looked like.
    • Label the Area and Perimeter of each item in the bedroom.
    • The items in the bedroom could also be made as separate cut-outs and arranged / rearranged on the “floor plan” to see all of the different ways the room could look.
    • Students in 3rd grade might want to use whole units, while 4th and up might be able to use half-units.
  • On a test, area answer choices would include ” ____ square inches” or “inches squared” or “inches²”  Answer choices for perimeter will omit the word “square.”

Continue reading

Geometry Part 6: Angles and Lines

by C. Elkins, OK Math and Reading Lady

When working with students on geometry lessons involving angles and lines, I notice many misconceptions. So . . . I thought I would share them with you on this post. Some activity ideas and freebies are located at the end of this post.

Right Angles:  

  1. Students can only see the 90° angle if it is presented in the direction as a capital L.
    • Try turning the angles in different positions.
    • It is still considered a “right” angle even though it is turned to the left, up, or down.
  2. Students are told if they can draw a square inside the angle, then it is a right angle. So if it looks “squarish” to them, they think it’s a right angle.
    • Show them how to put the square corner of a piece of paper or index card into the angle to check. Take time to have them practice – don’t assume they know how.

Acute Angles (angles less than 90°):

  1. Students often can’t tell if the angle is <90° if it is oriented upside down or if one of the rays is not aligned horizontally.
    • Show how to put the square corner of a piece of paper into the angle to check. If the paper covers up the angle, it is <90°.
  2. Students are told an acute angle “is a cute little angle.”  I am guilty of having done this in the past. But if a student sees any angle made up of short lines, they may interpret it as “little” or acute.
    • Remind them it’s the size of the angle that makes it acute, not the size of the lines.
  3. While right angles are exactly 90°, students may expect an acute angle to be given a specific number.
    • Acute angles range from 1° to 89°.

Obtuse Angles (angles greater than 90°): Continue reading

Geometry Part 5: Composing and Decomposing 3D Shapes (+ surface area)

by C. Elkins, OK Math and Reading Lady

Composing and decomposing 3D shapes should help your students become more familiar with their attributes. Here are a few activities to help.  With emphasis on hands-on methods, examining real 3D shapes may help students find edges, vertices, and faces better than pictorial models.

  1.  Nets of 3D shapes are the least expensive way to get a set of 3D objects in each child’s hand, especially since most classrooms just usually have 1 set of plastic or wooden 3D shapes.
  2.  Build cubes and rectangular prisms using blocks or connecting cubes.
  3. Construct / deconstruct prisms using toothpicks, straws, coffee stirrers, craft sticks, or pretzel sticks as the edges. For the vertices, use clay, playdough, gum drops or slightly dried out marshmallows.
  4. Lucky enough to have a set of tinker toys? Or Magna Tiles? (We got our grandson some Magna Tiles and he loves them!  These tiles have magnetic edges which can hook together in an instant. Creating a cube, rectangular prism, pyramid, etc. is easy!  They are kind of expensive, but very versatile and creative.)
  5. Teach students how to draw 3D shapes. When composing a 3D shape, a student becomes more aware of the 2D faces, the edges, and the vertices they are drawing. Plus, if needed the student can draw the 3D shape on paper to assist them if taking a computer based assessment.  Here is my tutorial (below), but I’ll also include a couple of good websites in case you are 3D challenged. Click HERE for the pdf of the templates below.
  6. Observe how students count the edges, vertices, and faces.  If they are randomly trying to count them, they likely will be incorrect.  When needed, show them how to be methodical with their counting (ie: When counting the edges of a cube, run your finger along the edge as you count. Count the top 4 edges, then the bottom 4 edges, then the 4 vertical edges = 12.)

One of my favorite lessons regarding decomposing shapes is when teaching students (5th grade and up) how to measure surface area.  Click HERE for the free pdf guide for creating the rectangular prisms shown below.  It includes a blank grid so you can create your own (all courtesy of http:illuminations.nctm.org using their “dynamic paper” lesson). Continue reading

Geometry Part 4: More Composing and Decomposing

by C. Elkins, OK Math and Reading Lady  

There are so many good ways to help students compose and decompose shapes (2D and 3D), so I will focus on some more by using tangrams and 2D paper shapes. In case you missed it, my last post focused on ways to use 1″ color tiles and pattern blocks to compose and decompose shapes. Click HERE to link back to that.

  1. Give students paper shapes of these polygons:  rectangle, square, hexagon, trapezoid, rhombus. Click here for a FREE pdf copy: Decompose and Compose Polygons.
    • Students should color each paper shape one solid color (a different color for each shape). My advice is to use light colors because they will be drawing lines on the shapes and light colors enable them to see the lines.
    • Model how to draw 1 or 2 lines to decompose the shape into smaller shapes.  For first and 2nd grade, I recommend you show them how to use at least one corner of the shape to connect to another corner or side using a straight edge or ruler. This way the newly created shapes will resemble ones they already know (triangle, trapezoid, rectangle). Older students can be given a little more leeway — their decomposing may result in other more irregular polygons. Here is one way to decompose.
    • Cut apart on the lines. Have students put their initials or name on the back of each piece (in case it gets separated or ends up on the floor).
    • Each student puts their cut-up pieces in a baggy for safe-keeping. Then the student can take them out and try to compose them back into their original shapes.  This is where the color-coding comes in handy (all the yellow go together, all the green, etc.).
    • Students can trade their baggies with others to compose their shapes.
    • When students are done with the shape puzzles, they can glue them back together on background construction paper (or take them home for practice, or keep at school for ongoing work).
    • Discuss together how many different ways these shapes were decomposed using 1 or 2 lines.
  2. Use the book, “The Greedy Triangle” by Marilyn Burns 
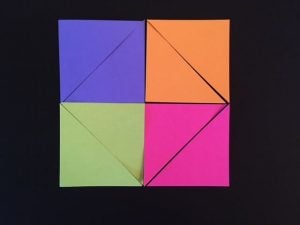
as a springboard to compose other polygons using various numbers of triangles.  In this book, the triangle keeps adding a shape to himself (after a visit to the “Shapeshifter”). There are many good pictures in this book illustrating common things with the named shape.  This is also a great way to connect art to math. You can start with squares which the students must cut in half on the diagonal, or start with pre-cut triangles. Length of edges must match. Level 0 students can just try out different combinations. Level 1-2 students would analyze the properties more and name the new shapes. You can even emphasize symmetry (as I have shown with the bottom row). Here is the link to the full article about this wonderful activity. Math Art: The Greedy Triangle Activity

Continue reading

Geometry Part 3: Composing and Decomposing

by C. Elkins, OK Math and Reading Lady

Composing and decomposing geometric shapes (2D and 3D) should be centered around concrete and pictorial methods. In this and upcoming posts, I will illustrate some methods using various manipulatives and line drawings which help students take a shape apart or put shapes together. If you refer back to  Geometry Part 1: The Basics, all grade levels KG-5th have standards dealing with this issue. Some of the experiences I plan to share will also help students relate to multiplication, division, fractions, area, and other geometry concepts (such as rotations, reflections, slides).

Refer to Geometry Part 2: van Hiele levels to determine if the activities you are choosing are appropriate for Level 0, 1, or 2 students.

One Inch Color Tiles:

1.  Can you make a larger square out of several individual squares?

  • Level 0 students will be using the visual aspect of making it look like a square.
  • Level 1 students will be checking properties to see if their squares are indeed squares (with the same number of tiles on each side).
  • Level 2 students will be noticing they are creating an array (ex: 3 x 3 = 9) and perhaps learning about squared numbers. 3 squared = 9. They might be able to predict the total number of tiles needed when given just the length of one side.

2.  How many rectangles can you make using 2 or more squares? (Level 0-1)

  • Level 1:  Are the green and blue rectangles the same size (using properties to determine)?

Continue reading

Geometry Part 2: Learning Continuum (van Hiele)

by C. Elkins, OK Math and Reading Lady

Today’s post will focus on an aspect of geometry involving levels of thought.  We know PreK or KG students aren’t ready for formal definitions regarding shapes. Starting about 2nd grade, students might be ready to describe shapes using specific attributes. Pierre and Dina van Hiele are Dutch math educators who have an excellent way to describe how children move through these geometric thinking levels.  They are called “The van Hiele Levels of Geometric Thought.” Click on this link for a full description:  The van Hiele Model   Also – some good resources at the end of this post.

I became interested in these levels as I was doing research about better ways to help students master standards in Geometry.  (See more information below regarding these levels.)  Am I supposed to teach them the “proper definition” of a square in KG? At what point should students begin to understand the specific properties of a square – that it is actually a specific type of rectangle. And . . . when is it appropriate to help students realize that a square is also classified as a rhombus, rectangle, parallelogram, and quadrilateral? Click on the link for a pdf copy of the chart below: van Hiele Levels 0, 1, 2

What can we as teachers do to help them move through the levels? According to van Hiele, the levels can’t be skipped – children must progress through each hierarchy of thought. So while there is no grade level attached to these levels,  I like to think of the Visualization Level as the beginning point most appropriate for PreK-1st or 2nd grade students. Level 1 thinking might surface in grade 2 or 3 (and up). Students capable of Level 2 thinking may start with 3rd – 8th grade. Students in high school geometry might function at Level 3 thinking.

One of the properties of the levels he described has the name of “Separation.” The article linked above states: A teacher who is reasoning at one level speaks a different “language” from a student at a lower level, preventing understanding. When a teacher speaks of a “square” she or he means a special type of rectangle. A student at Level 0 or 1 will not have the same understanding of this term. The student does not understand the teacher, and the teacher does not understand how the student is reasoning. The van Hieles believed this property was one of the main reasons for failure in geometry. Teachers believe they are expressing themselves clearly and logically, but their Level 3 or 4 reasoning is not understandable to students at lower levels. Ideally, the teacher and students need shared experiences behind their language.

Here’s a closer look at the levels. Continue reading

Geometry Part 1: The Basics

by C. Elkins, OK Math and Reading Lady

For many schools, it seems as if Geometry and Measurement standards remain some of the lowest scored. This has always puzzled me because it’s the one area in math that is (or should be) the most hands-on — which is appealing and more motivating to students. Who doesn’t like creating with pattern blocks, making 2 and 3D shapes with various objects, using measurement tools, and getting the chance to leave your seat to explore all the classroom has to offer regarding these standards? So what is it about geometry and measurement that is stumping our students? Here are some of my thoughts – please feel free to comment and add your own:

  • Vocabulary? (segment, parallel, trapezoid, perpendicular, volume, area, perimeter, etc.)
  • Lack of practical experience? Not all homes have materials or provide opportunities for students to apply their knowledge (like blocks, Legos, measuring cups for cooking, tape measures for building, etc.).
  • Background knowledge about the size of actual objects? We take it for granted students know a giraffe is taller than a pickup truck. But if students have not had the chance to go to a zoo, then when they are presented a picture of the two objects they might not really know which is taller / shorter. Think of all of the examples of how we also expect students to know the relative weights of objects. Without background knowledge or experience, this could impede them regarding picture type assessments.
  • Standards keep getting pushed to lower grades when students may not have reached the conservation stage? If they think a tall slender container must hold more than a shorter container with a larger diameter, or they think a sphere of clay is less than the same size sphere flattened out, they may have difficulty with many of the geometry and measurement standards.

In this post, I will focus on Geometry. Here is a basic look at the geometry continuum (based on OK Stds.):

KG:  Recognize and sort basic 2D shapes (circle, square, rectangle, triangle). This includes composing larger shapes using smaller shapes (with an outline available).

1st:  Recognize, compose, and decompose 2D and 3D shapes. The new 2D shapes are hexagon and trapezoid. 3D shapes include cube, cone, cylinder, sphere.

2nd: Analyze attributes of 2D figures. Compose 2D shapes using triangles, squares, hexagons, trapezoids and rhombi. Recognize right angles and those larger or smaller than right angles.

3rd:  Sort 3D shapes based on attributes. Build 3D figures using cubes. Classify angles: acute, right, obtuse, straight.

4th:  Name, describe, classify and construct polygons and 3D figures.  New vocabulary includes points, lines, segments, rays, parallel, perpendicular, quadrilateral, parallelogram, and kite.

5th: Describe, classify, and draw representations of 2D and 3D figures. Vocabulary includes edge, face, and vertices. Specific triangles include equilateral, right, scalene, and isosceles.

Here are a couple of guides that might help you with definitions of the various 2D shapes. The 2D shapes guide is provided FREE here in a PDF courtesy of math-salamander.com.  I included a b/w version along with my colored version. The Quadrilateral flow chart I created will help you see that some shapes can have more than one name. Click on the link for a free copy (b/w and color) of the flow chart. Read below for more details about understanding the flow chart.

PLEASE note these very important concepts: Continue reading

Illuminations NCTM Interactives

Resource – http://illuminations.nctm.org

Review by Cindy Elkins, OK Math and Reading Lady

This is a math resource I absolutely love! It is a product of the National Council for the Teachers of Mathematics (NCTM). This site includes lesson plans and interactive activities. Search in several ways: by topic, by standard, or by grade level. Need some strategy games? Check out “Calculation Nation” (some of which can be played against other players), and “Brain Teasers.” I have just added this link to my Resources page (on my blog home page).

Many of the lessons connect to exploration projects and literature. The interactive features are outstanding!! These are perfect for the smartboard, on laptops, or tablets. Once you are on the home screen, click the Interactives box (right side) and then the desired grade level. There are dozens of great applets, but here are a few you might really like. I have linked them for easy reference, so just click on the  title and you’ll be there:

Dynamic Paper: Customize graph paper, number lines, spinners, nets, number grids, shapes (to include pattern blocks, color tiles, and attribute blocks), and tessellations. You can also choose inches or cm. These can be customized, saved and printed as jpeg or pdf. I created the spinner shown here.

Five Frame and Ten Frame tools: Geat activities to build number sense using five or ten frames. These may take 1-2 minutes to load.

Cubes: Build a rectangular prism one cube, or row, or layer at a time and then compute the volume or surface area.

Coin Box: Drag and exchange coins. There is also a feature I like (the grid at the bottom right corner), which puts coins in blocks (by 1s for pennies, 5s for nickels, 10s for dimes, and 25s for quarters). This really helps see the value of the coins. Want more info about coin blocks? Once on the Coin Box page, click on the “Related Resources” tab.

Equivalent Fractions: Build different fractions in circular or rectangular format. Compare them and see them on a number line. You can manipulate the numerators and denominators to see fractions change right before your eyes! Others for fractions: Fraction Models (which includes decimal and percent equivalencies) and the Fraction Game.

Geometric Solids: Create a shape (either transparent or solid) and swivel it around to see all of the faces, vertices, and edges.

For your graphing needs, check out the Bar Grapher, Circle Grapher, and Data Grapher. With these tools you can create graphs using any of your own data. Some of these need Java installed.

Enjoy these and so many more!!! Let us know if there are others you recommend.