by C. Elkins, OK Math and Reading Lady
Last week, we looked at some ways to gain number sense about decimals. This post will address using decimals in the operations of addition and subtraction . . . and how to model concretely and pictorially. You can also download the color grid pages along with a free decimal math game in this post. Part 3 (future post) will address multiplication and division of decimals.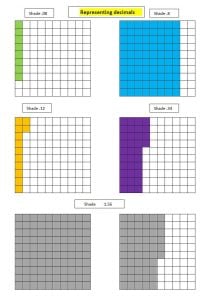
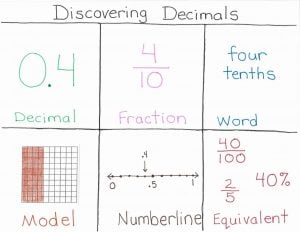
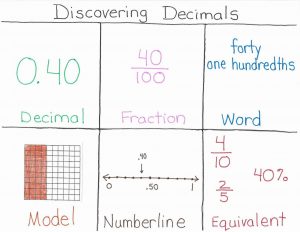
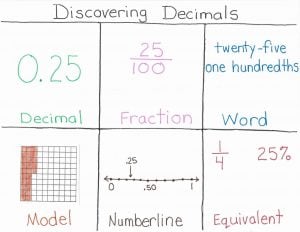
If you missed last week’s post, please review it first before continuing with this one. Before performing various operations with decimals, students must have a basic understanding of how to represent them concretely, pictorially and numerically. Example: .8 = .80 can be proven with base ten blocks and with 100 grid drawings. This understanding should also be linked to fractions: 8/10 is equivalent to 80/100. Click here for pdf of Representing Decimals page.
Addition
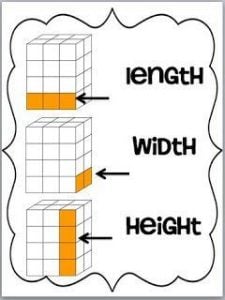
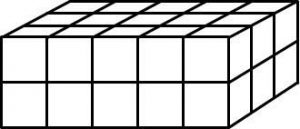
For concrete practice, use a 100 base ten block to represent the whole (ones), the tens rod to represent tenths, and unit blocks to represent hundredths. Construct each addend and then combine them. Ten tenths’ rods become one whole. Ten hundredths cubes become one tenth.
-
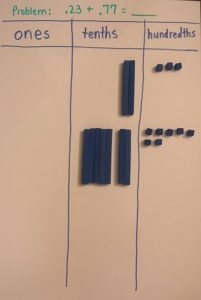
- Show both addends
-
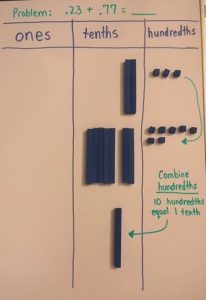
- Regroup 100ths into 10ths
-

- Regroup tenths into ones
-
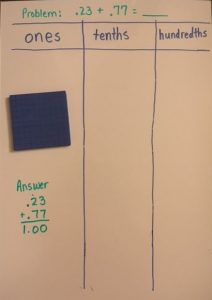
- Trade 10 tenths for 1 whole
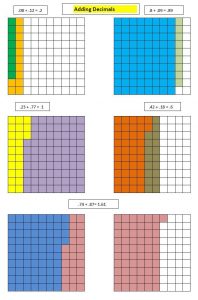 In a pictorial model, shade in the ones, tenths and hundreds on hundred grids. Use different colors to represent each addend. Click here for pdf of Adding Decimals page.
The concrete and pictorial models will also prove .8 = .80, reinforcing the concept that adding a zero to the right of a decimal does not change its value. This will be an important factor when moving to the standard algorithm vertical addition model.
Using an open number line is also a good pictorial model to use when adding decimals, especially if students are already familiar with its use regarding addition of whole numbers. This method reinforces number sense of the base ten system because you continually think, “What goes with .07 to make a tenth?” (answer = .03); or “What goes with .9 to make a whole?” (answer: .1).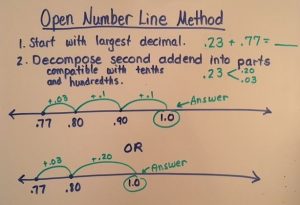
A method called partial sums should also help students gain place value number sense along with addition of decimals. Each step is broken down (decomposed). 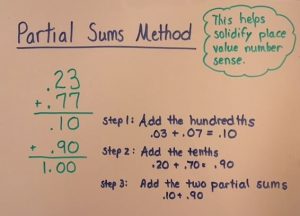
Estimating will also be a critical addition problem solving step focusing on number sense. If adding 34.78 plus 24.12, does the student realize their answer should be somewhere close to 35 + 24? Are they thinking, “Is my first number closer to 34 or 35?” What is halfway between 34 and 35 (34.5 or 34.50)? Where would 34.78 fall if it was on a numberline between 34 and 35? (See my post on rounding for more details.) Continue reading

 Here’s a matching activity / game in which students match decimal to fraction, word form, expanded form, money, and pictorial form. Included is a blank page so you can make your own or have students take notes. Click here for the FREE activity:
